BNB Value Surges and Analysis
The value of Binance Coin (BNB) has recently surged to approximately $520, showcasing a promising opportunity for a significant rebound. This upward trajectory in BNB’s price mirrors the impressive performances of other prominent cryptocurrencies like Ethereum and Bitcoin, underscoring the global investor community’s confidence in the burgeoning digital currency market.
Continuing its ascent, BNB has successfully breached the critical resistance levels at $550 and $565, catapulting the digital asset above the crucial threshold of $580. This pivotal level represents the 61.8% retracement level based on Fibonacci analysis, tracing the recent price movement from a peak of $630 to a trough of $512. Notably, BNB currently trades above $580 and the 100 simple moving averages on the 4-hour charts, signifying its robust growth as a digital asset.
Fibonacci Retracement and Future Outlook
Upon closer examination of the Fibonacci retracement levels, BNB is positioned slightly above the 76.4% level, corresponding to the prior downtrend from $630 to $512. This indicates sufficient buying pressure to sustain and potentially propel the price further upward. Interestingly, a strong bullish trend line has emerged around the $592 mark on the BNB/USD 4-hour chart, reinforcing the bullish sentiment.
Looking ahead, the BNB price forecast anticipates formidable resistance levels ahead, notably at $608 and $630, where price consolidation may occur. A decisive breakthrough above $630 could unlock the path for bullish momentum towards $650, with potential for further gains towards the $680 resistance zone and even a target of $720 in the near term, contingent upon market dynamics and trends.
Despite the positive momentum, challenges may arise, with failure to breach the $608 resistance potentially triggering a price retracement. In such a scenario, initial support is expected around $592, coinciding with the established trend line, while additional support levels at $585 and $570 play a crucial role in sustaining the uptrend. However, breaching these support levels could expose BNB to significant selling pressure, directing the price towards $550 and possibly even $532.
Technical Indicators and Market Sentiment
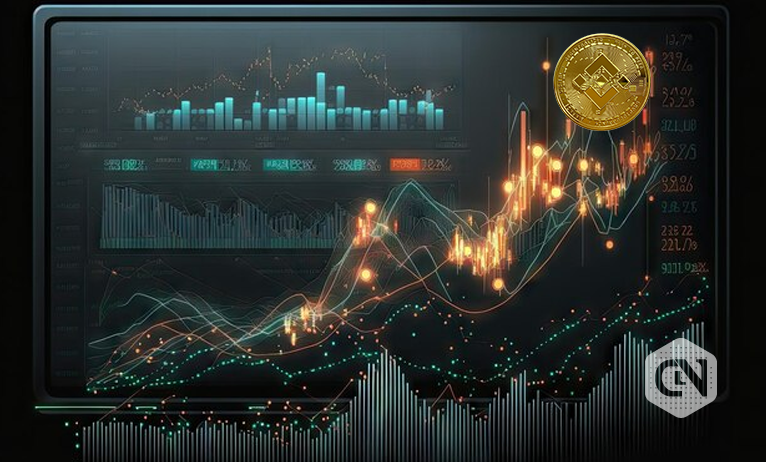
Furthermore, other technical indicators offer valuable insights into market sentiment and momentum. Observing the recent 4-hour chart for BNB/USD, the Moving Average Convergence Divergence (MACD) signal has surged into the bullish territory, indicating a notable increase in buying interest among traders. Additionally, the Relative Strength Index (RSI), a metric measuring the magnitude of price changes, has surpassed the 50 threshold, underscoring the strength of the current market trend.
Overall, Binance Coin exhibits robust signs of an upward trajectory, buoyed by strengthening technical factors and a positive market outlook reminiscent of trends in leading cryptocurrencies. In the dynamic landscape of digital assets, BNB’s growth trajectory presents a promising outlook, contingent upon effectively navigating challenges and leveraging market opportunities.
Image/Photo credit: source url