Analysis of Bitcoin’s Supply Last Active (SLA) Chart
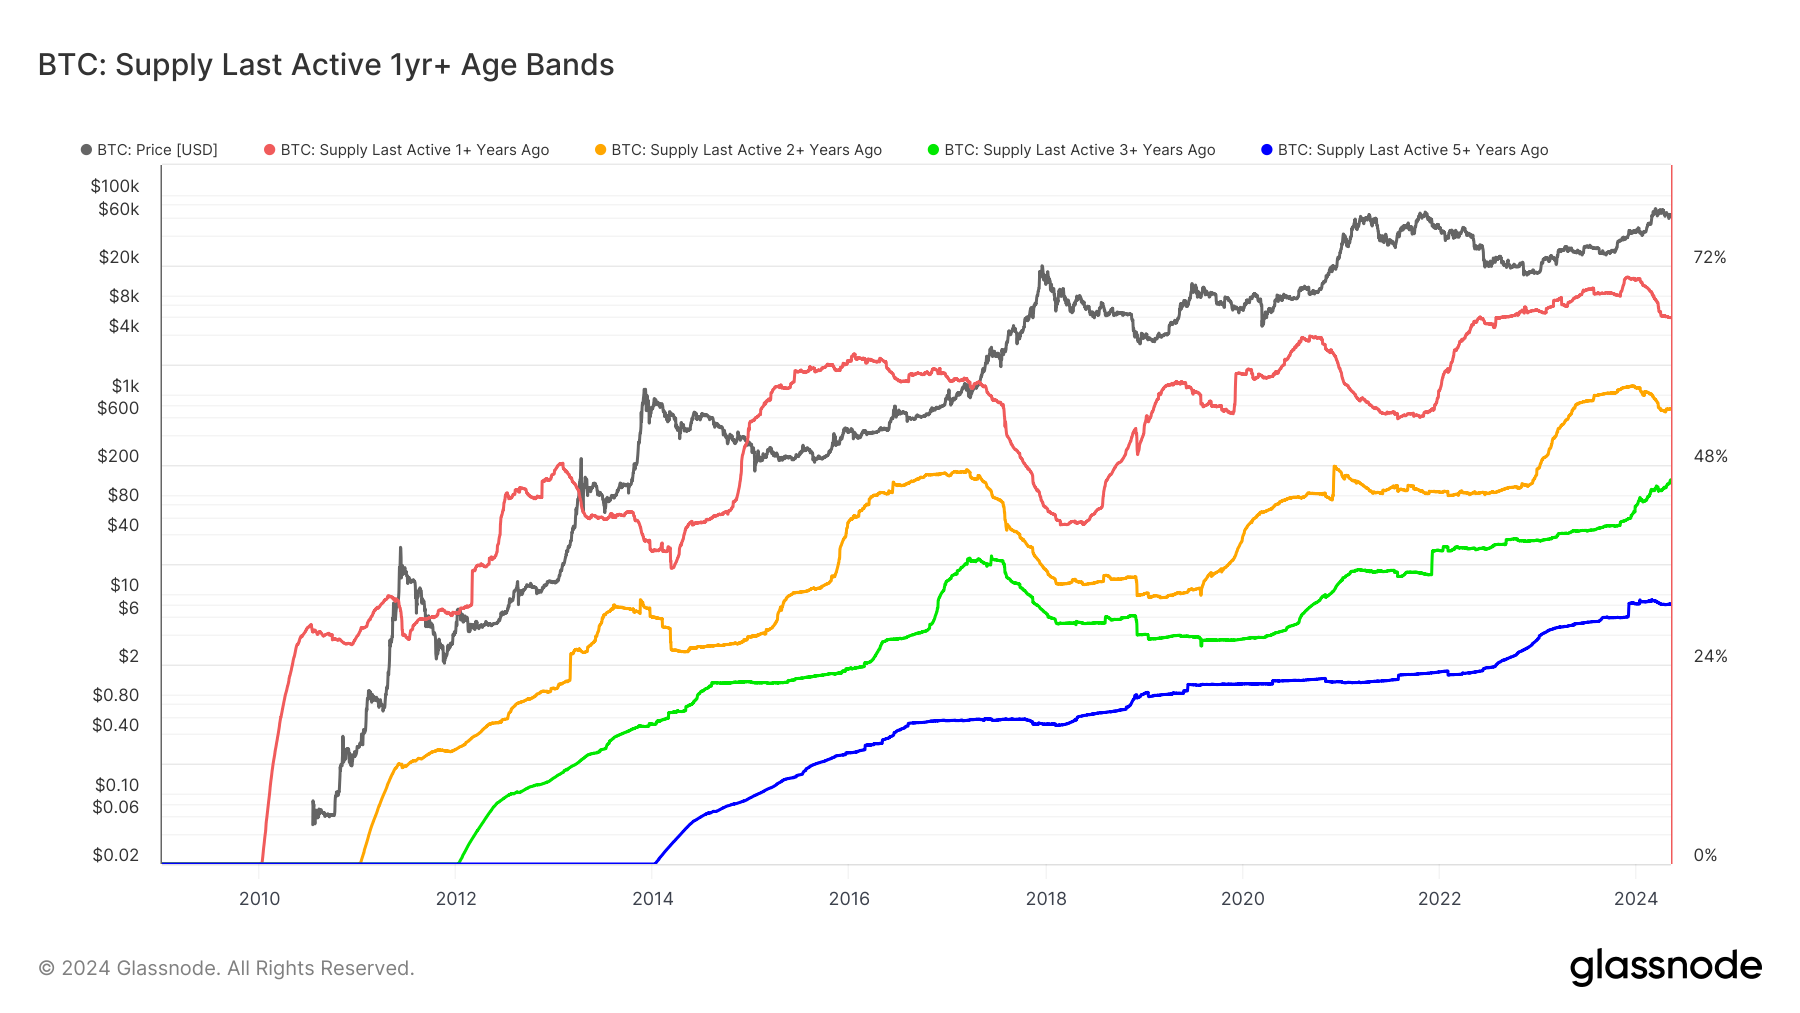
The Glassnode supply last active (SLA) chart presents a unique perspective on Bitcoin’s circulating supply by segmenting it into different cohorts based on the duration since the coins were last active. These cohorts, including 1+ years, 2+ years, 3+ years, and 5+ years, offer valuable insights into the behavior of long-term holders (LTHs) and their commitment to retaining their assets.
Recent Trends
Recent data from Glassnode reveals that towards the end of 2023, all SLA cohorts reached their peak levels. However, the launch of the US Bitcoin ETF, coupled with outflows from GBTC and selling by LTHs, caused a temporary dip in the SLA metrics. Specifically, the SLA 1+ year cohort decreased from over 70% to 66%, while the SLA 2+ years cohort dropped from above 57% to just over 54%, where it has since stabilized.
Resilience of Long-Term Holders
It is noteworthy that the SLA 3+ years cohort, encompassing coins held since the onset of the 2021 bull market, exhibited remarkable resilience during this period. The cohort witnessed an increase from around 42% to slightly over 46%, marking a new all-time high. This indicates that a substantial number of investors from that epoch have retained their positions despite market fluctuations.
Looking ahead, the forthcoming months will provide valuable insights into the behavior of holders who weathered the storm during the Bitcoin price decline from $50,000 to $30,000 between May and July 2021 amidst the China mining ban.
Image/Photo credit: source url