Glassnode’s Bitcoin Spot Cumulative Volume Delta Reaches Record High in 2024
Glassnode’s Bitcoin Spot Cumulative Volume Delta (CVD) achieved its highest reading of the year on March 11, totaling nearly $900 million. This substantial increase in the CVD metric, which evaluates the net variance between intense buying and selling activity across major cryptocurrency exchanges, signals a robust bullish sentiment within the Bitcoin market.
Hourly Analysis of Buying Activity
An examination of the hourly data reveals a surge exceeding $360 million around 7 am UTC, coinciding with Bitcoin’s price escalation from $68,500 to $71,200 within a span of 3 hours. The remaining purchasing actions primarily transpired before 8 pm UTC, with approximately $70 million in selling pressure occurring around 10 am, followed by another surge at 3 am on March 12.
Editorial Note: It is essential to acknowledge that the CVD data might not encompass all Bitcoin transactions due to extensive over-the-counter (OTC) trading activities occurring off exchanges. The correlation between the $360 million surge and the $3,000 price hike in Bitcoin represents only a fragment of the overall picture. Deriving ratios solely from this value could yield an overly optimistic outlook. Nonetheless, this data serves as a critical component in calculating buying ratios for Bitcoin.
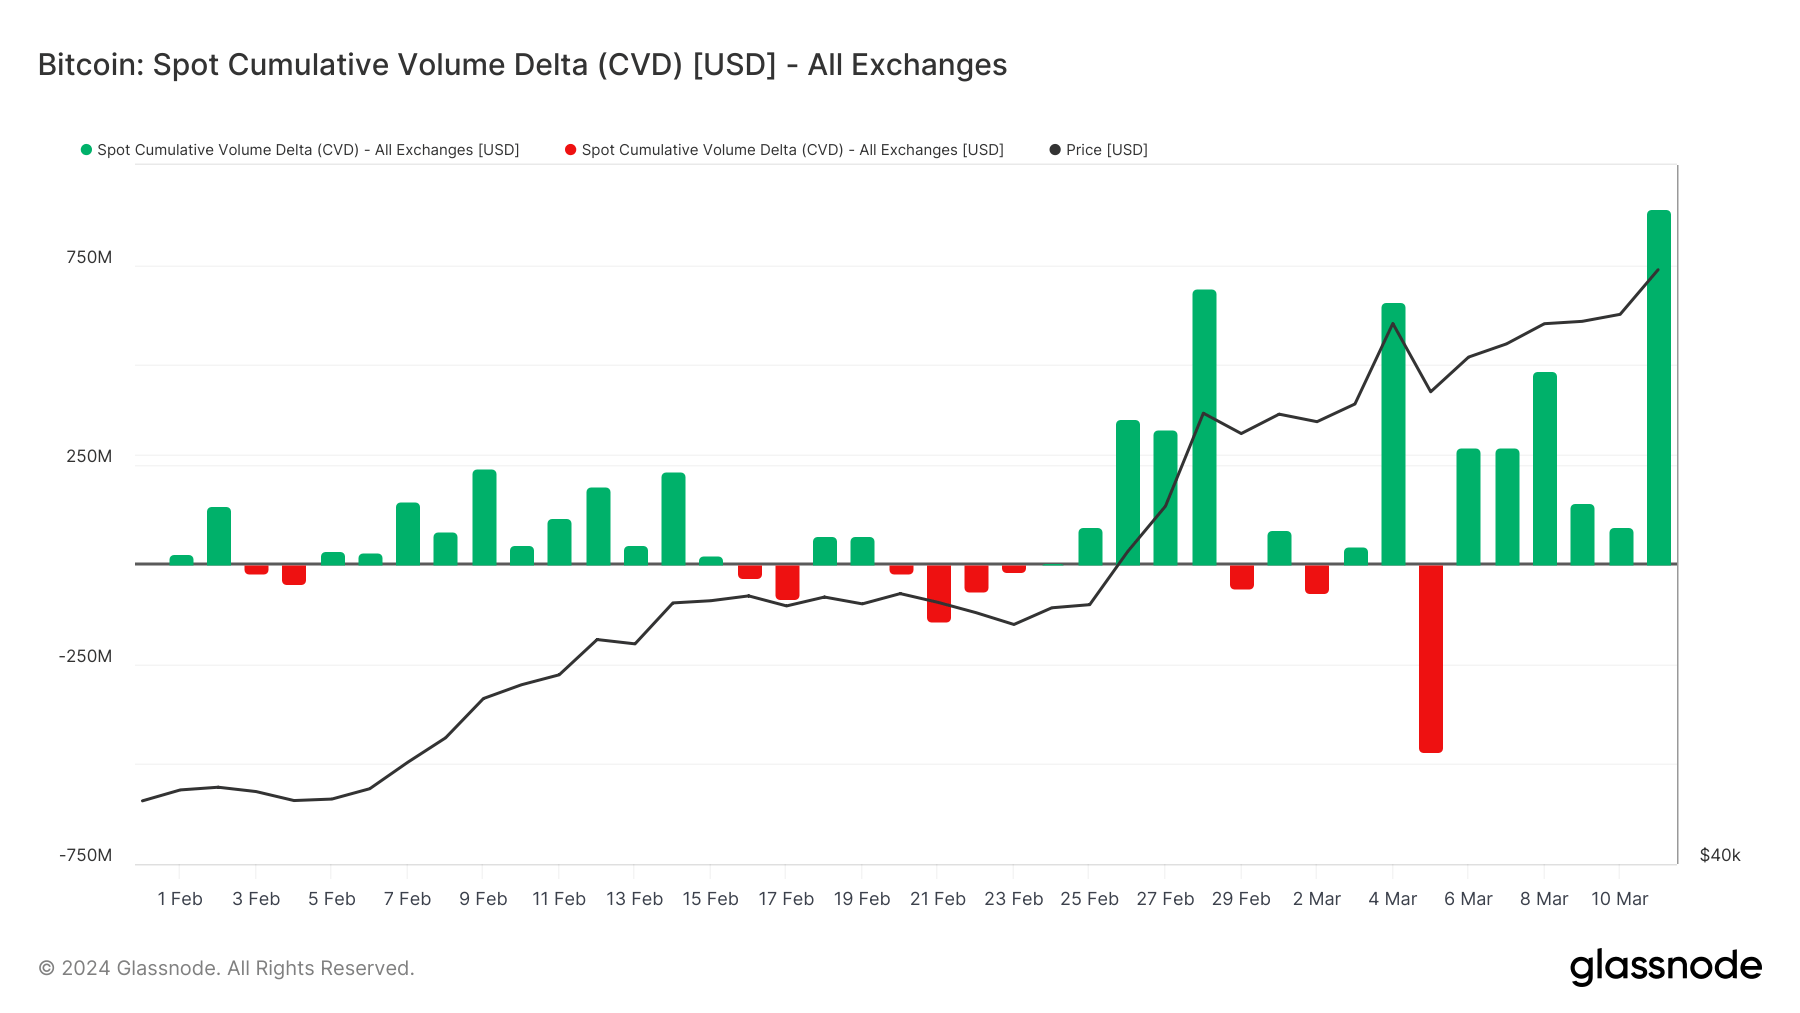
Contextualizing the March 11 Spike
The notable surge on March 11 follows a period of volatility in the CVD during the initial months of 2024. The year commenced with the indicator positioned positively before transitioning to negative figures in early January, indicative of a shift towards selling pressure subsequent to the launch of spot ETFs in the US. Nevertheless, the CVD swiftly rebounded into positive territory by late January and early February, reflecting renewed buying interest.
Throughout February, the CVD oscillated between positive and negative levels, portraying a continual struggle between buyers and sellers. A remarkable peak towards the end of February coincided with Bitcoin’s price surpassing $40,000. As March began, the CVD encountered further fluctuations, including a sharp decline early in the month aligning with a brief drop in Bitcoin’s price.
Interpreting the Significance of the March 11 Data
The remarkable reading on March 11 serves as a potentially pivotal bullish indicator amidst the recent market turbulence. Functioning as an on-chain metric capable of reflecting and potentially forewarning significant price shifts, the Bitcoin Spot CVD furnishes invaluable insights into the supply and demand dynamics of Bitcoin. The record-setting figure observed on March 11 implies a mounting trend of aggressive buying activity, suggesting optimistic prospects for Bitcoin’s price trajectory in the immediate future.
Image/Photo credit: source url